
Mapping America’s Political Conversations with Claude
The first analysis of how Americans are using AI for politics, leveraging Anthropic's Economic Index data. Users get info from Claude, not recommendations; and they seek more of it near elections.
In July, the New York Times reported on people across the country photographing their ballots and asking chatbots to help them fill them out:
“It was probably only a matter of time before voters began to use artificial intelligence to help guide their choices. The 2026 midterms may be the first American elections in which voters are using A.I. in meaningful numbers.
Voters are turning to new A.I. tools to serve as nonpartisan researchers, viewing them as a viable alternative to traditional news coverage, voter guides or social media. They provide an appealing and seemingly efficient way to learn about campaigns and ballot measures, allowing users to bypass the sometimes dizzying array of political literature, advertising and commentary coming their way.”
These are interesting stories, but we know remarkably little about how representative this is of what people in general are using AI for when it comes to politics. Existing data doesn’t help much. Surveys tell us half of American adults now use AI chatbots, but pollsters rarely ask about political usage.
Google’s recent ATLAS report, which I covered, doesn’t disaggregate the data sufficiently to see specific political use cases—though it does indicate fascinating patterns in how people are using Gemini to help them with governmental tasks like filing taxes and procuring local licenses.
In this post, we offer the first real look at how Americans are using AI for politics. To do this, we use new data that Anthropic released from its Economic Index, built from real Claude conversations in April and May, with topics detailed enough to isolate political usage and geography detailed enough to track it state by state.
Because some states held their primaries in May during the study window while others did not, we have a “natural experiment” we can use—isolating the effect that a state-level election has on Claude conversations about politics in that state.
We find four main things:
Political AI use remains modest, but it’s still meaningful. Politics makes up about half a percent of Claude conversations in the U.S.—ranking 66 out of 189 topics, right next to home furnishing.
People are not yet getting political advice from AI. Political conversations overwhelmingly produce explanations and analysis, and only 3% end in advice or a recommendation which is markedly lower than other categories of conversation on Claude.
Elections drive a meaningful uptick in political usage. States holding May primaries saw their share of political conversations jump about 20%, an effect that holds up to a battery of statistical checks.
November could set a record. If primaries can lift political AI use this much, November’s midterm elections will likely bring the biggest wave of political AI use on record.
The first systematic data on AI for politics
The Anthropic Economic Index is a large-scale dataset that captures how real users are using a frontier model in the wild. Anthropic continually samples from all of the real interactions with their AI tools, anonymizes them, then labels a number of interesting dimensions including the subject of the request, the primary output the AI produces (e.g., an answer to a question, a document, or a script), the occupation associated with the conversation, the date and hour of the conversation, and the country and sub-country region of the user (state in the U.S.).
They release a public version of this dataset that includes only aggregates like the share of conversations that are primarily about each of nearly 1,200 topics broken out by month and sub-country region. They limit the release to cells that contain enough data that they are confident conversations cannot be reidentified.
Just last month, they released a new public version of this dataset covering conversations held in April and May of this year. Its ability to shed light on the contours of AI’s impact on our work and jobs has been well-noted—maybe less appreciated, though, it’s also a data goldmine full of interesting insights about the way Americans are using Claude to think about politics.
At Free Systems, we’re obsessed with studying what we call political superintelligence—how democracy works for a world in which everyone has access to cheap intelligence that can help them navigate politics. We’re also all about using AI to help us do cutting-edge empirical work. So this new data couldn’t be more perfect for us. It gives us the chance to measure, in almost real time, how Americans are starting to use AI for politics. So let’s dive in!
How much do people talk to Claude about politics?
As expected, the top requests to Claude in the U.S. are work- and school- related: business operations, homework, promotional writing, and starting a business are the top request subjects, each making up more than 3.5% of all Claude conversations and adding up to over 18% of all conversations combined.
Politics and public record is the 66th request topic by share of conversations out of a total of 189 topics. This places it just behind photo editing and API debugging; tied with home furnishing, home tech setup, and entertainment; and just ahead of AI agent design and vehicle-related requests.
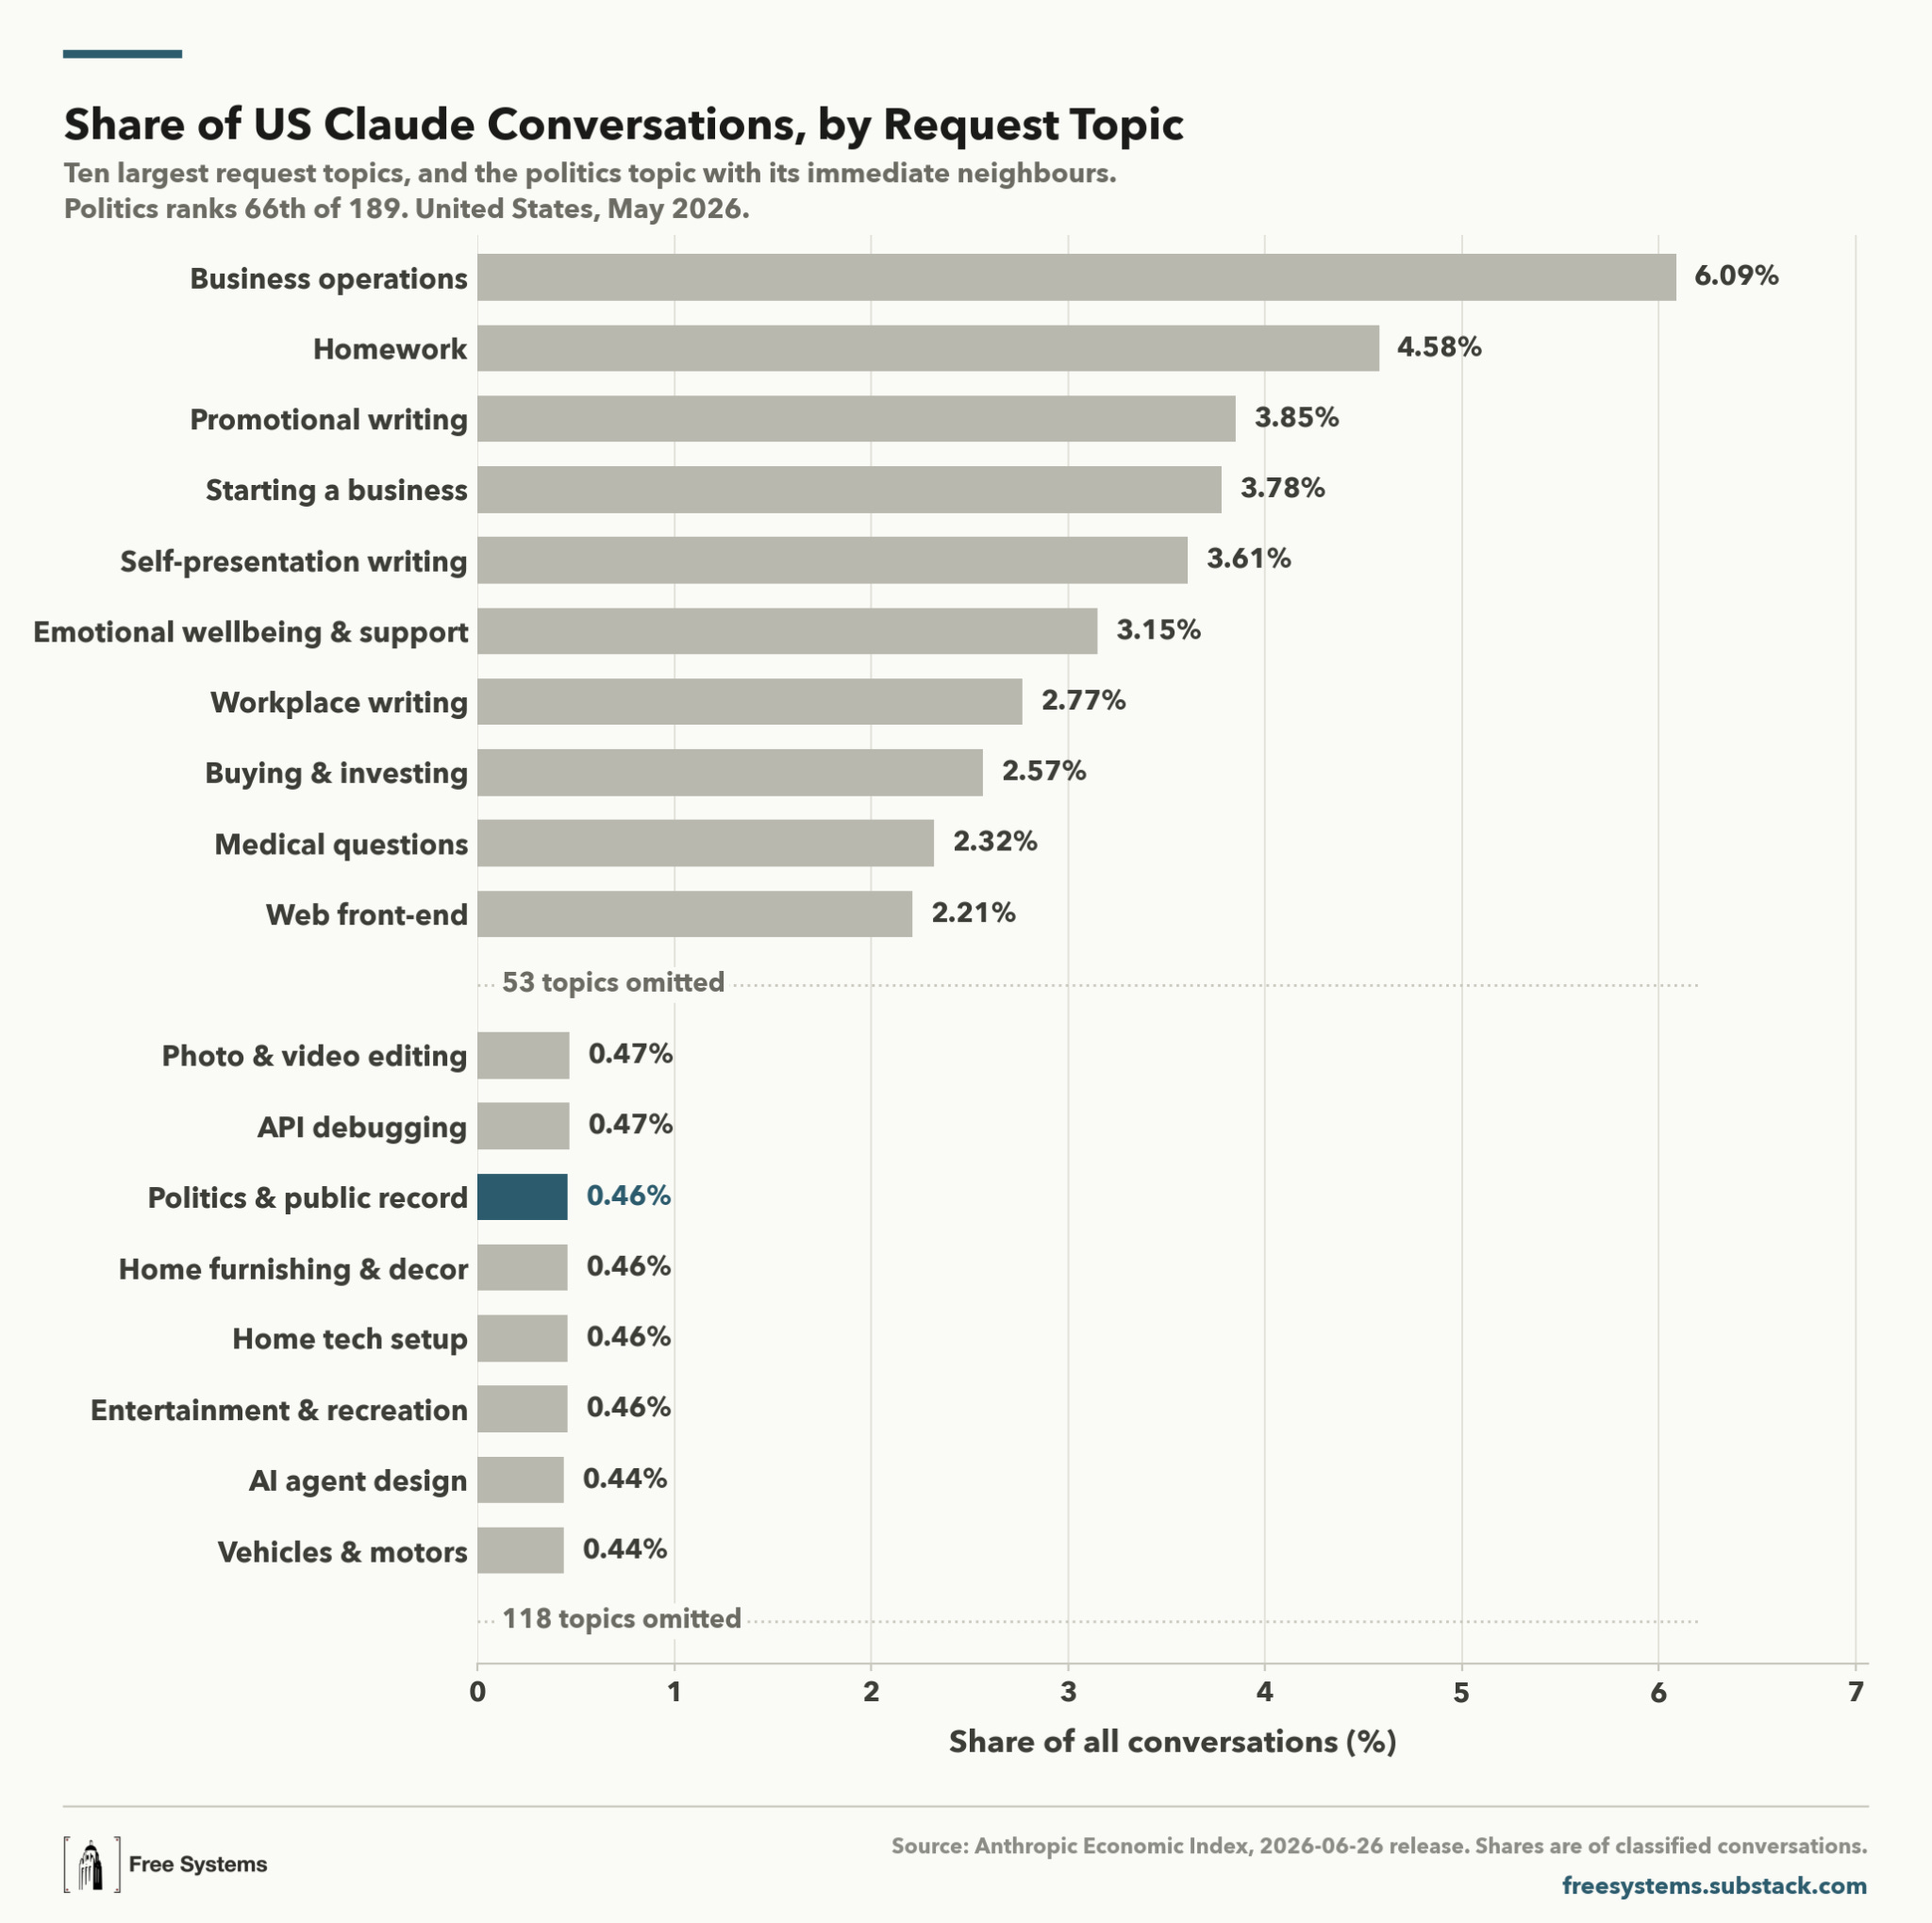
Politics is evidently only a modest share of total conversations, but that doesn’t imply it’s unimportant. During the long fight over social media and democracy, Facebook executives (during the time I was an advisor there) often pointed out that political content made up only about 6% of what users saw in their feeds. That was an important empirical point to make, but at the same time, many people felt that technology that touches billions of people can shape elections, movements, and civic understanding even through a thin slice of its total activity. Especially if that activity is particularly influential or emotive. The same logic applies here: half a percent of an enormous and fast-growing stream of AI conversations is still a very large number of Americans learning about their government, and these could be the kinds of conversations that stick with users far more than the typical one.
Users ask Claude for political information, not recommendations or actions
When people do talk to Claude about politics, what do they talk about?
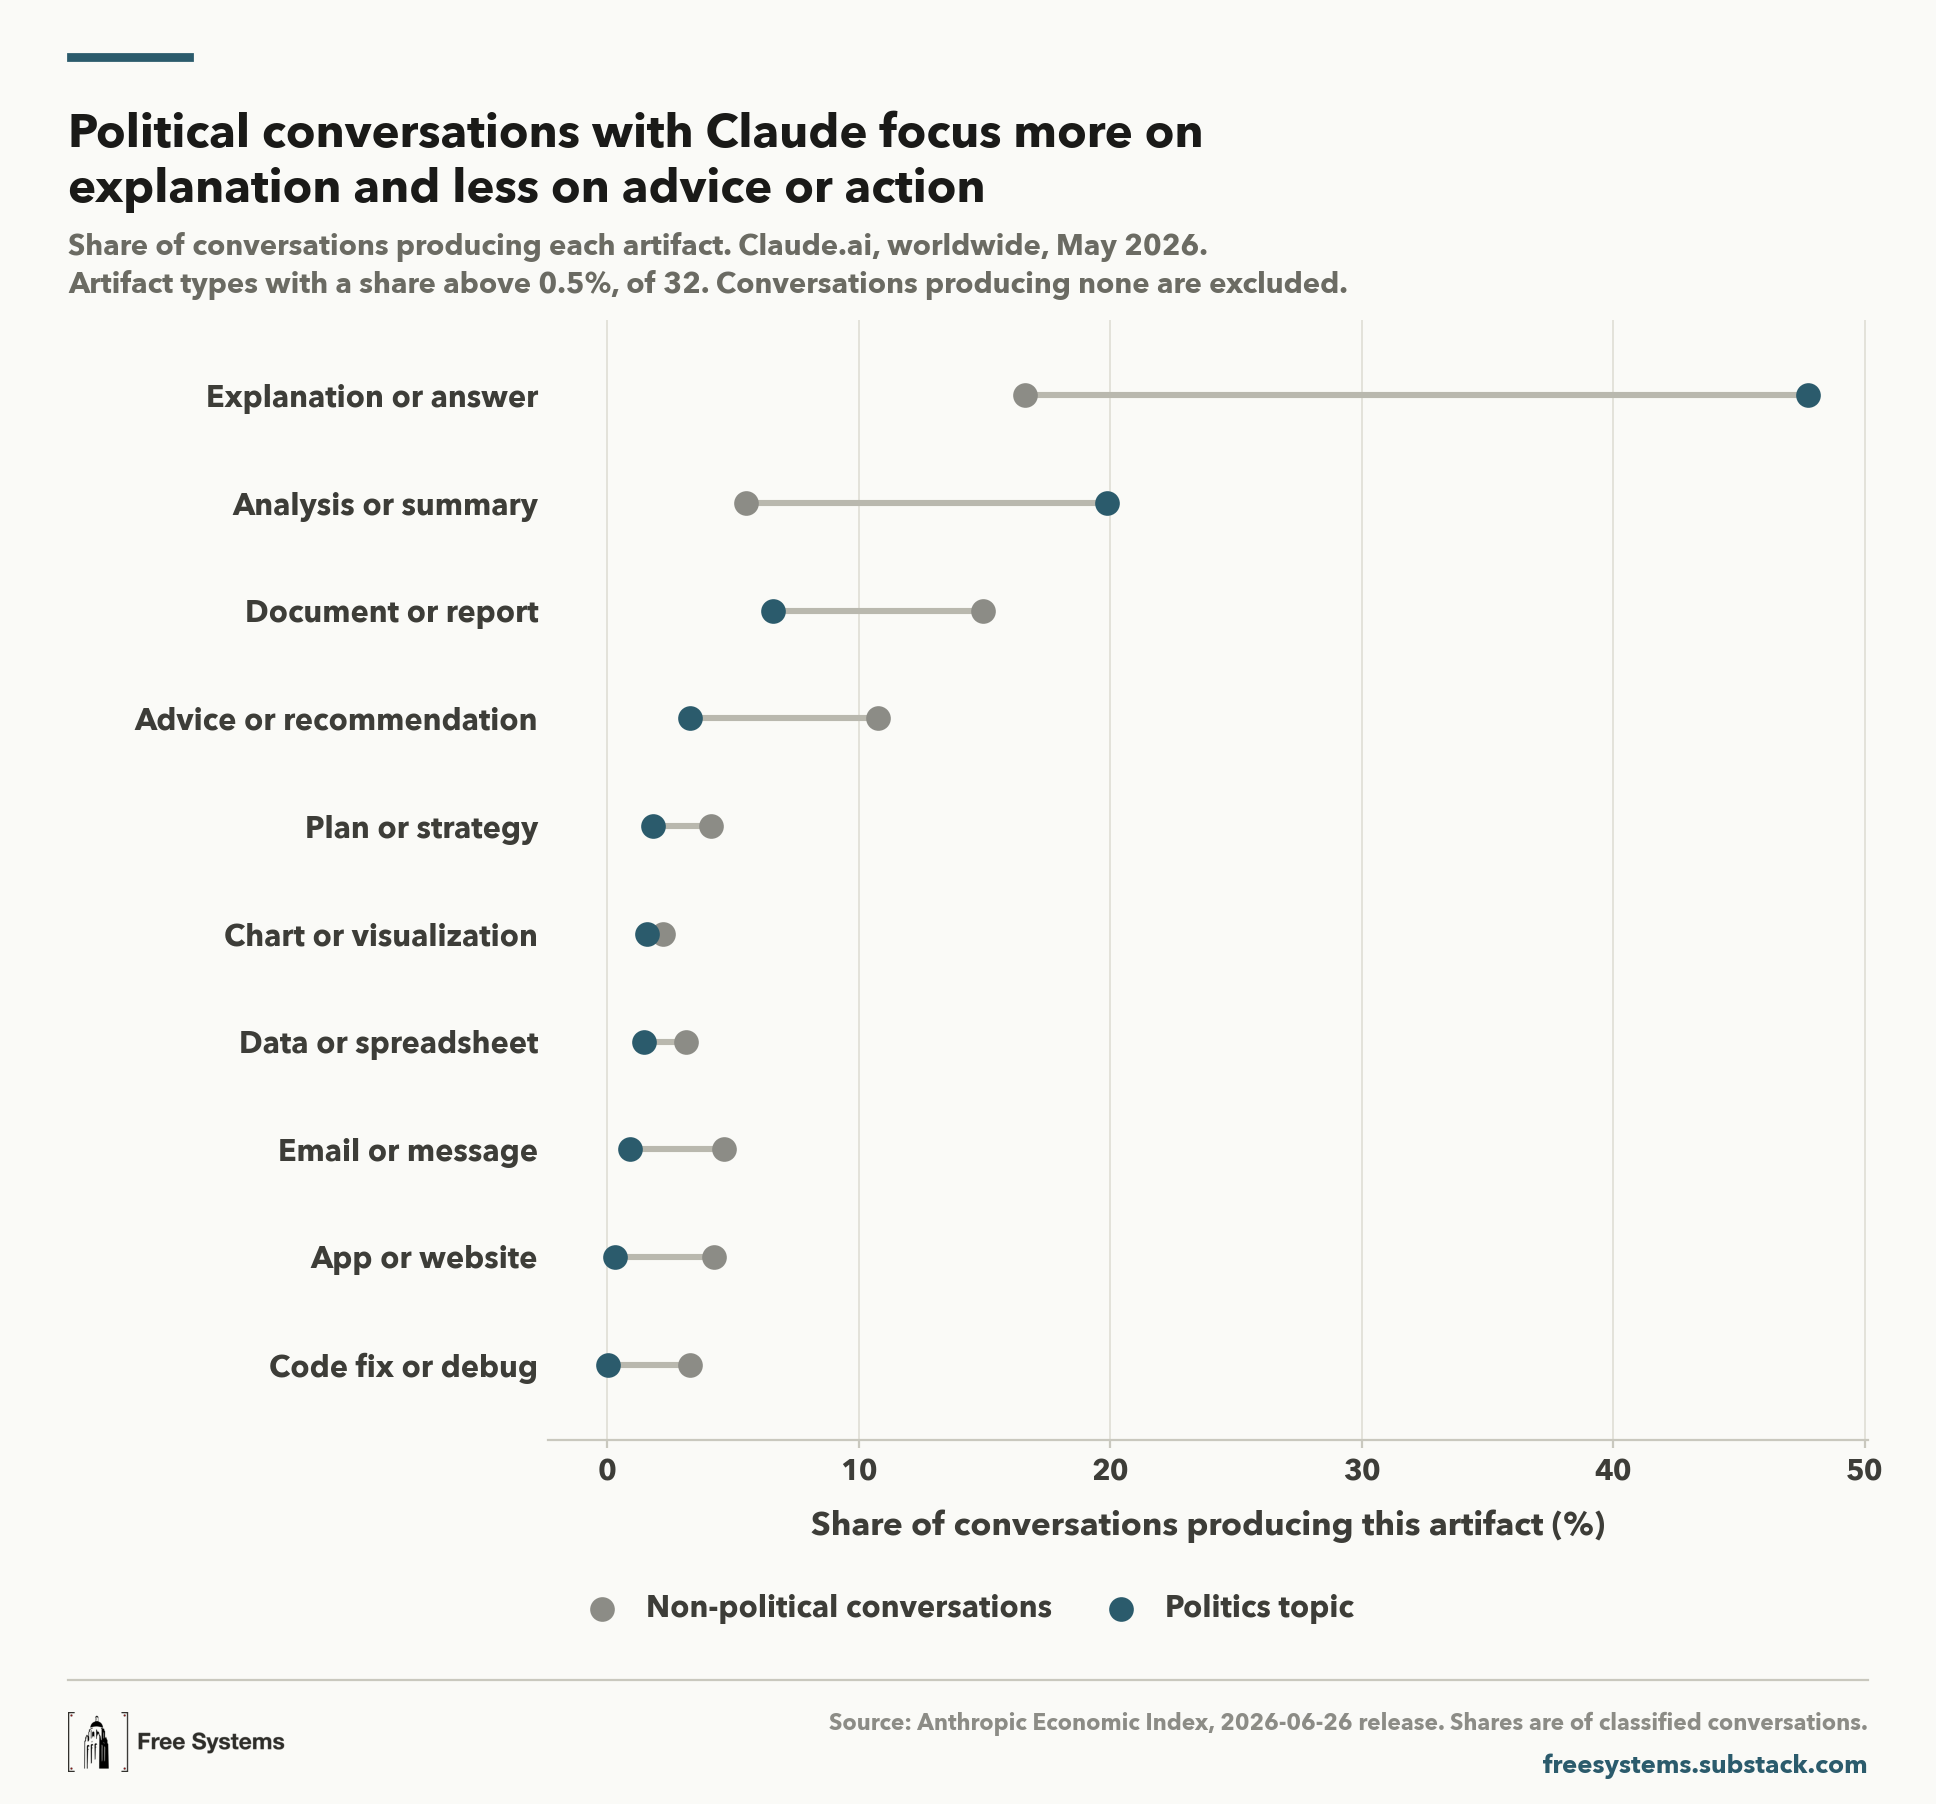
Most political requests to Claude today are seeking information—Claude responds to the majority of political requests with an answer or analysis, not code, a product, a document, or even advice. Nearly 50% of political requests result in an explanation, while less than 20% of all non-politics requests do so. While more than 20% of political conversations result in an analysis or summary, only about 5% of non-political conversations do so.
And, despite the potential for AI to guide voters on whom to vote for (I’ve explored the promises and limitations of AI’s ability to do so here), currently, only 3% of political conversations end in advice or a recommendation.
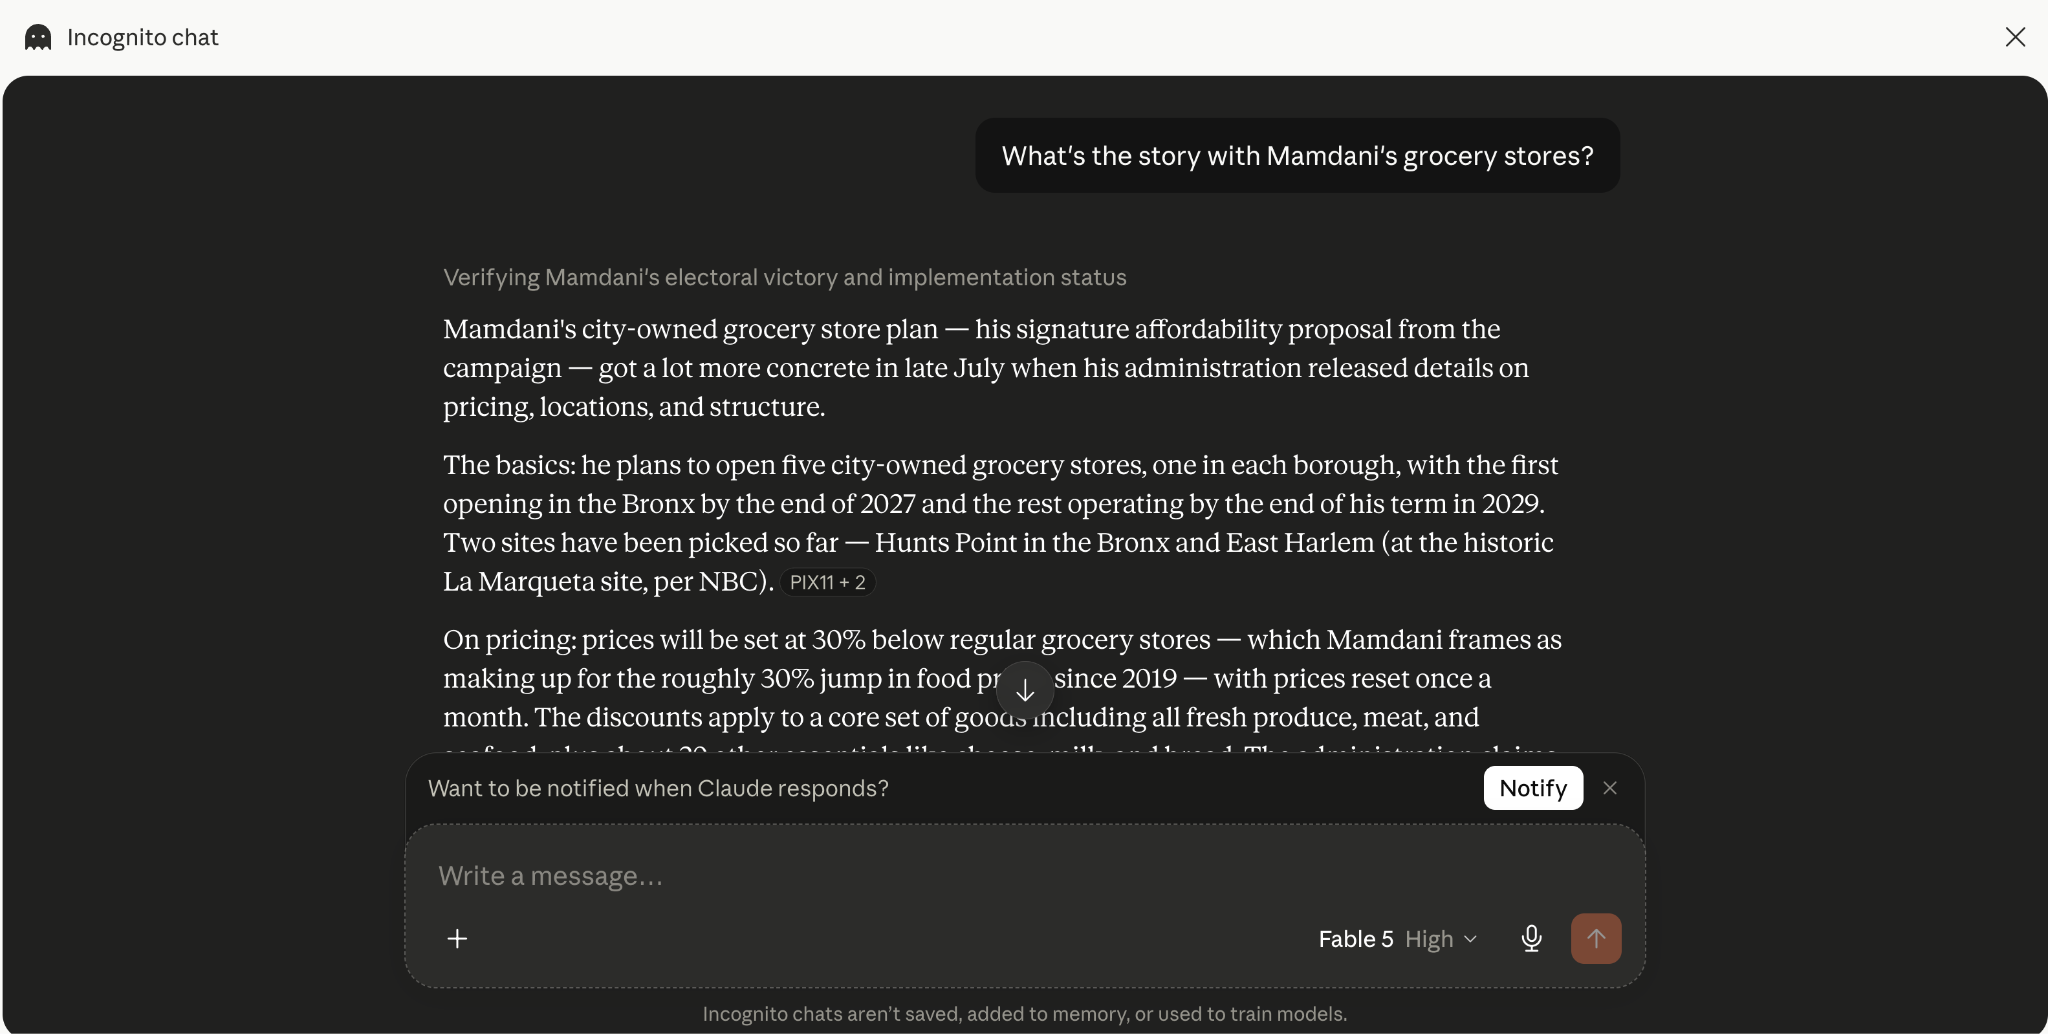
The vast majority of requests related to politics, public record, or elections result in some kind of information, rather than producing an action or a document. Here’s an example of what that might look like—I asked Claude to explain to me Mayor Mamdani’s recent grocery store experiment in New York City, and I got back information right in the chat, with no other artifact or action.
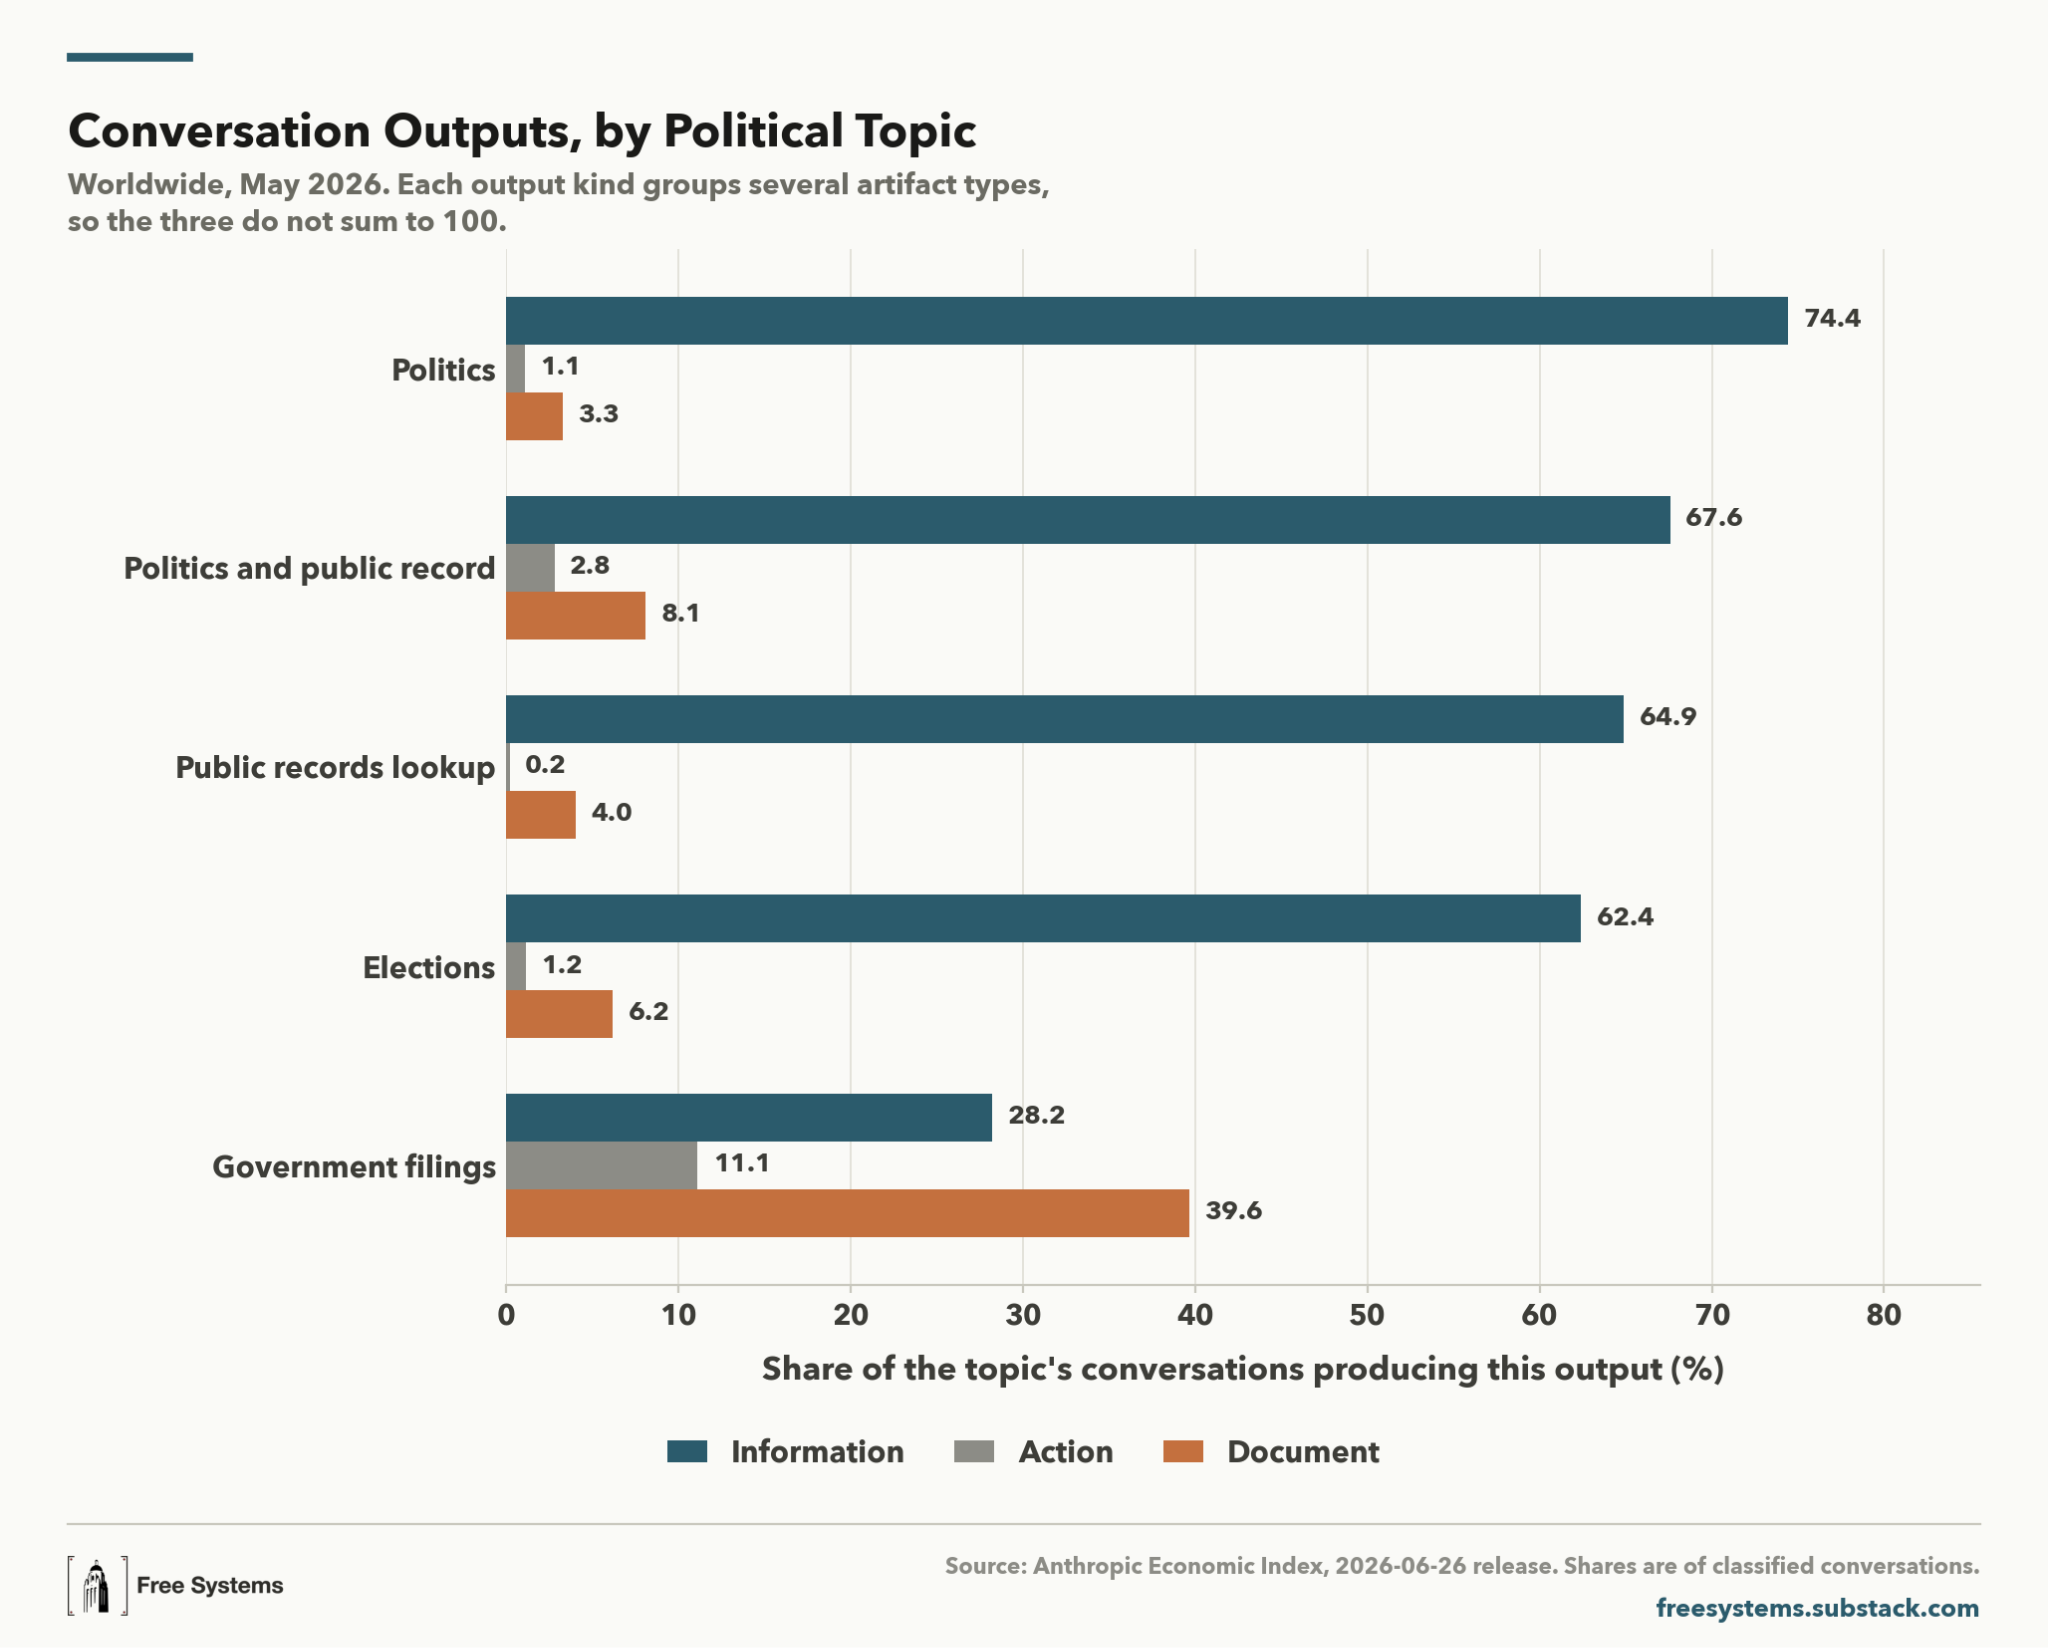
Interestingly, though, for the subset of requests that are about government filings, Claude prepares a document or takes an action roughly 50% of the time! Similar to what we saw in Google’s analysis of their ATLAS data, this suggests an exciting and not-so-distant future in which AI agents create and file documents on behalf of citizens—but it’s a rare action, for now.
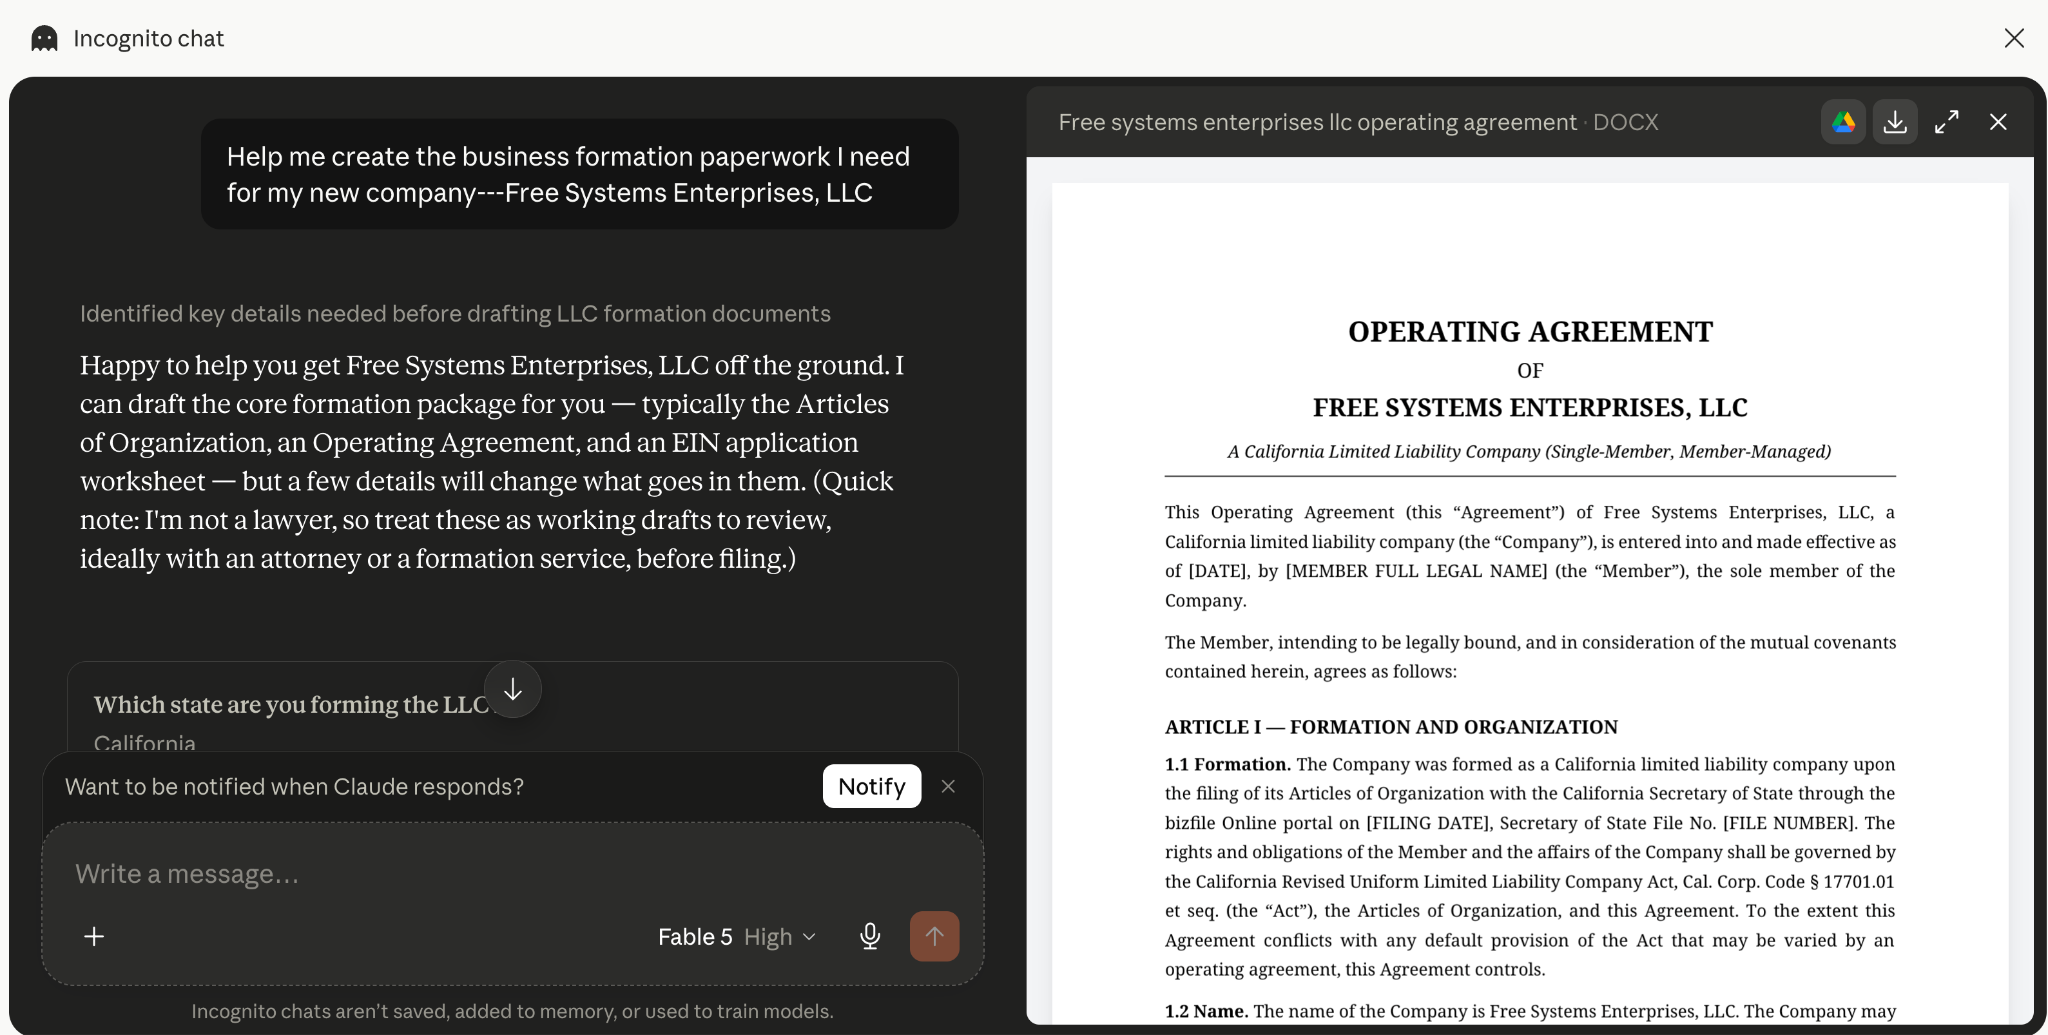
Here’s what such a task might look like. Here, I asked Claude to help me create business formation paperwork—and it did!
Elections drive a meaningful uptick in political AI usage
If people are turning to AI primarily to learn about politics, what kind of information are they looking for? In our representative democracy, one of the most natural things citizens might be looking for is information on who is running in an election, what they stand for, and how they’ve performed.
While we can’t observe those fine-grained categories directly, we can use the fact that different states hold primaries at different times of year to learn how much people are using Claude to learn about elections.
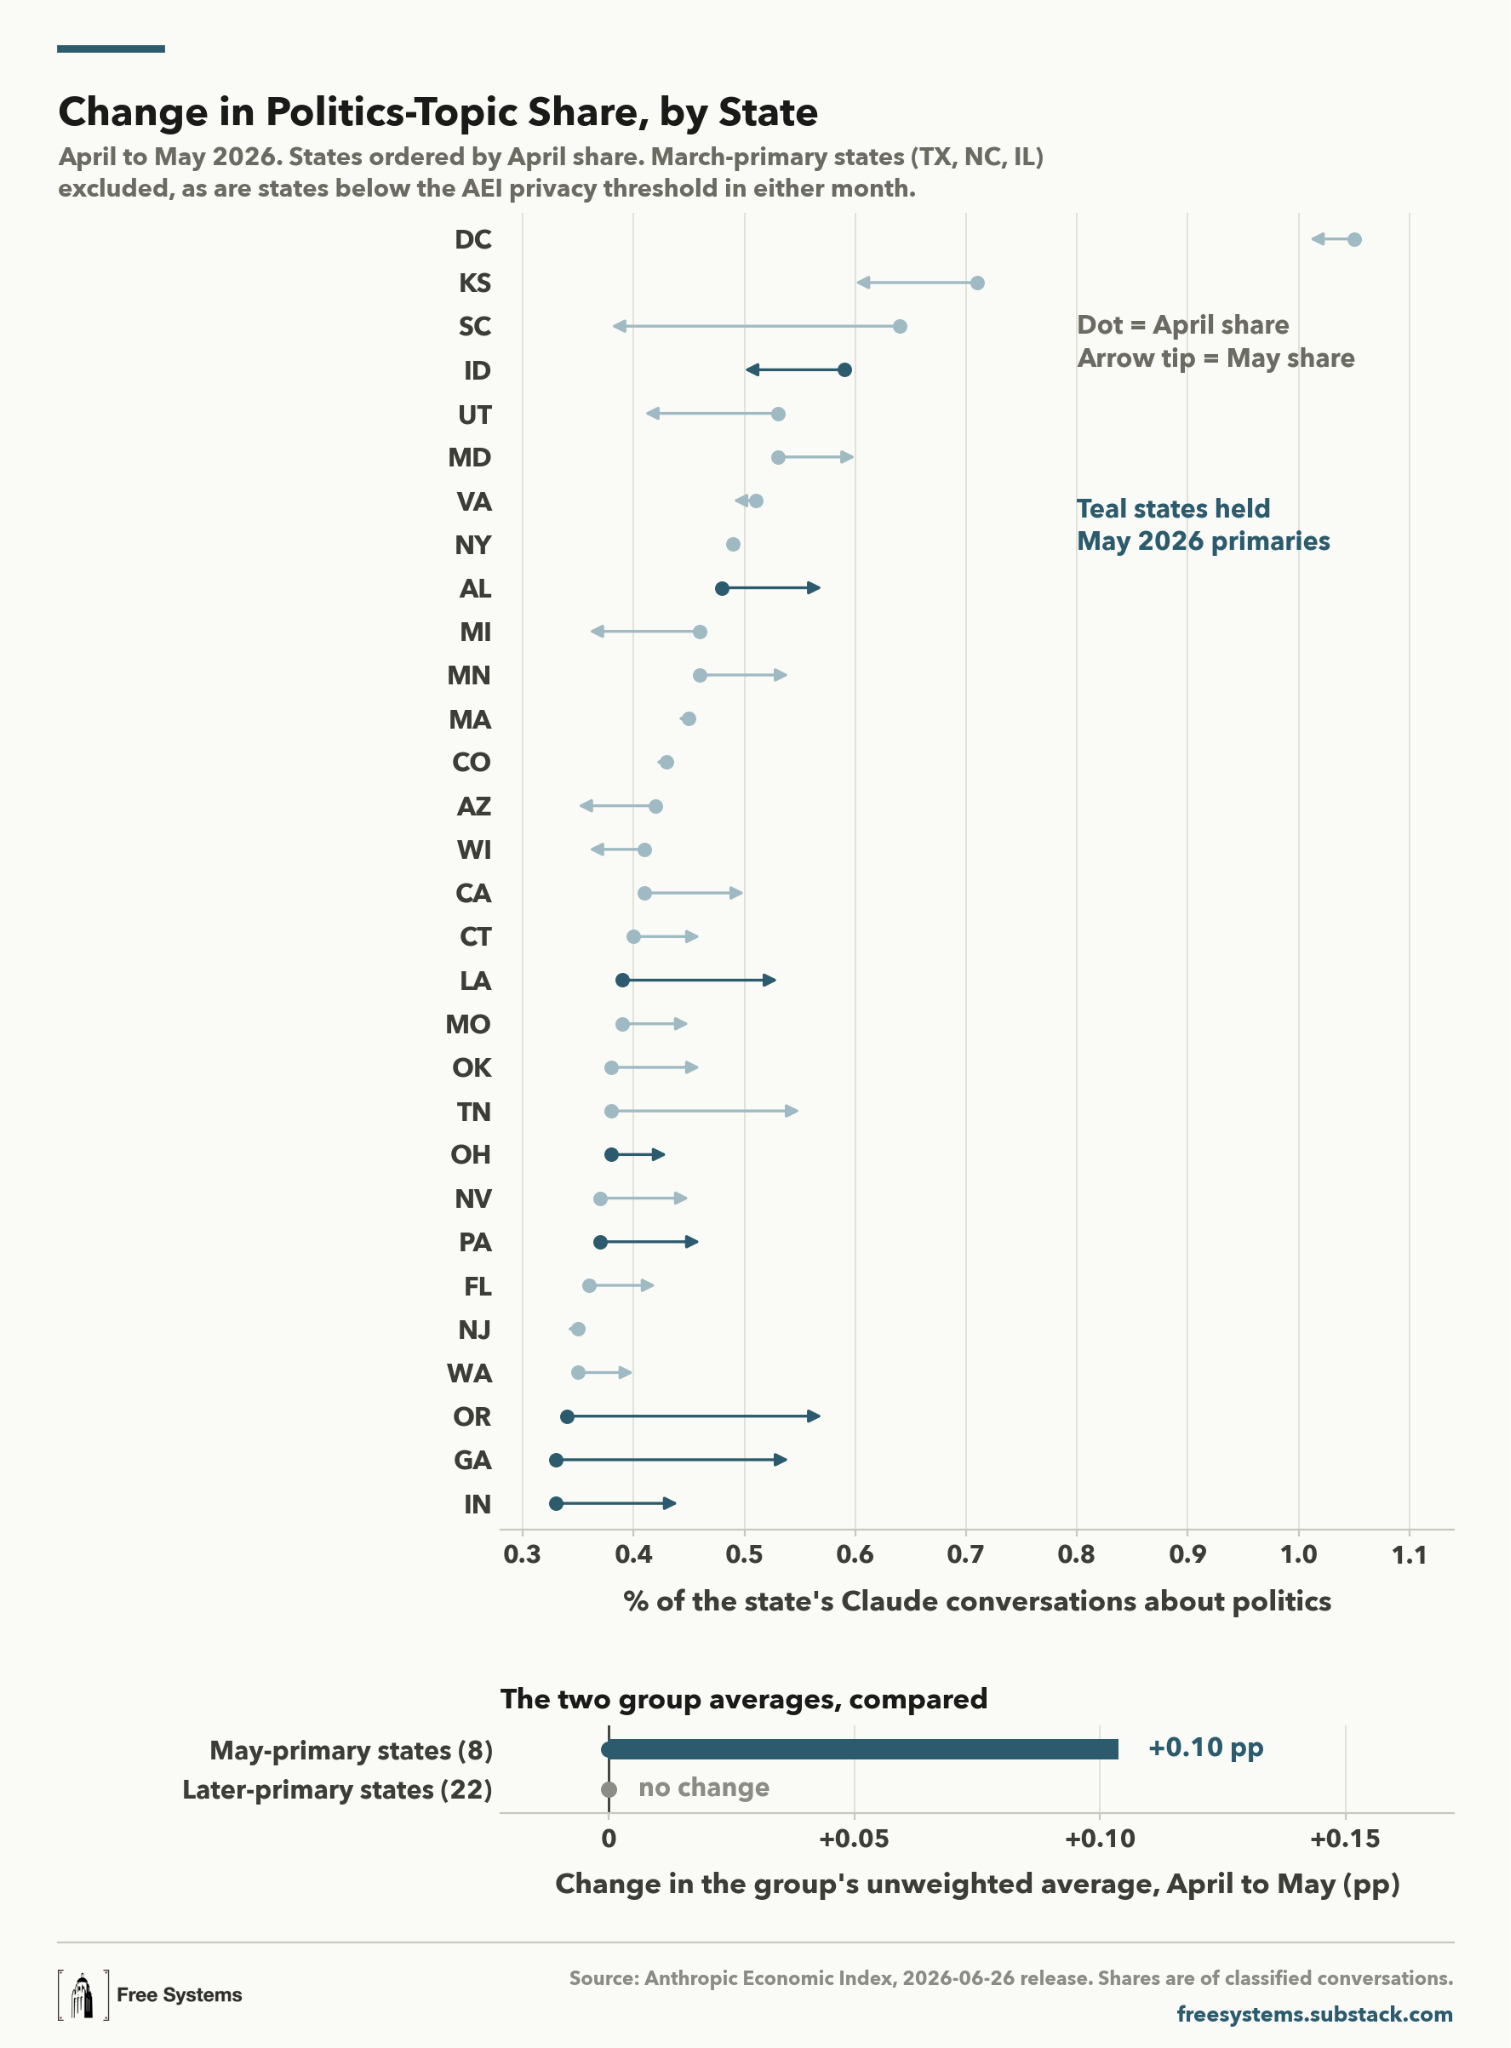
Eleven states held Congressional primary elections in May. Eight of those states had sufficient political AI conversation volume for the Economic Index to report it in both April and May. You can see those states in dark blue in the figure below. If substantial numbers of citizens are turning to Claude for information about elections, we should see an increase in political conversations in these eight states in May, and that’s exactly what the data reveals.
In the eight states with a May primary, the political request share rose from an average of approximately 0.4% in April to 0.5% in May, an approximately 25% proportional increase in the share of political conversations.
With only eight states, this “difference-in-differences” design could confuse a statistical fluke for a real effect—in the Statistical Appendix at the bottom of the piece, we look into this. We find no similar increase for related non-election topics, and we also find that the increase in the political topic is a huge outlier compared to estimated changes in other topics—all suggesting that the effect is probably genuine.
This is a large change in the share of AI conversations about politics. Just how large? Over the same April to May period, another big shift in AI use happened—the dramatic drop in the demand for AI tax advice. In April, 0.34% of conversations with Claude were about taxes. In May, that number dropped to 0.14%. So, this 0.2 percentage-point drop for taxes is about twice as large as the effect of a primary on the share of requests about politics.
Put another way: the increase in information-seeking behavior caused by an election is about half as large as the increase caused by the need to file taxes.
Expect a large increase in political AI usage this October/November
Taxes are part of everyone’s life. Primaries generally only attract the most engaged citizens. In general elections, we’d expect much broader participation and perhaps an even larger effect, possibly rivaling the effect that the tax deadline had on the share of conversations about taxes.
To get a sense for where we might be headed this fall, look at Oregon. Oregon held its primary in May and had unusually high participation—approximately 37% of Oregon adults voted in the May primary, the highest turnout of all the states holding May primaries. Oregon also exhibited the biggest increase in political queries in Claude from April to May.
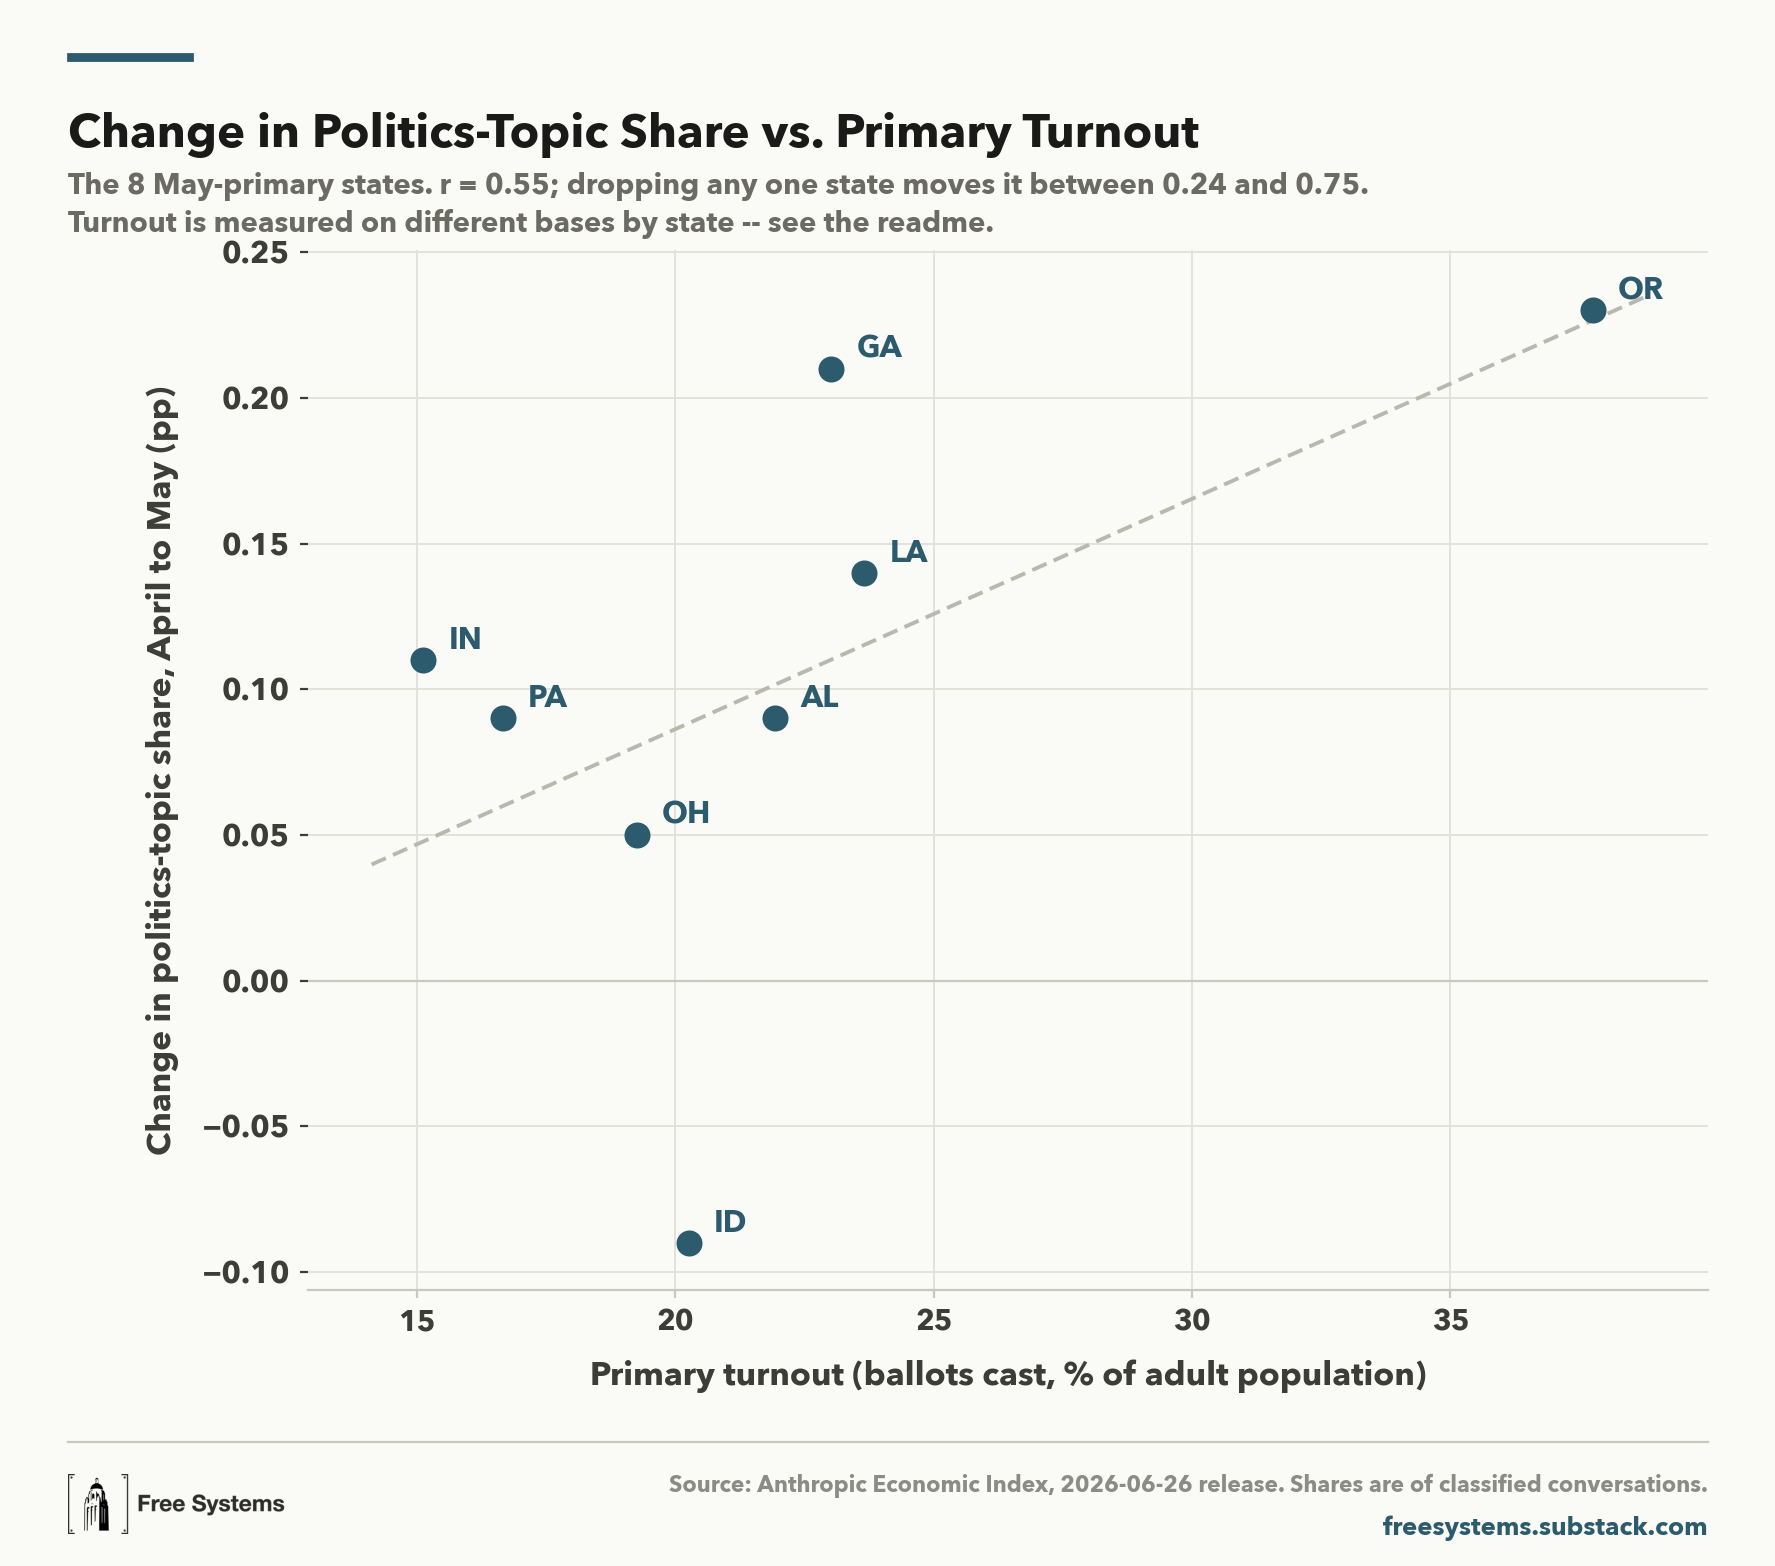
In November, we can expect between 40% and 45% of U.S. adults to participate if history is any guide, pretty similar to Oregon’s turnout in May. So, crudely speaking, we might expect national queries about politics to increase by about the same amount Oregon did. That would put politics at about 0.7% of Claude queries, and move its ranking from 66th to 41st—roughly the same frequency of conversations around booking and scheduling.
Conclusion
What does this early data tell us about how Americans are using AI for politics? Americans are talking to Claude about politics—overall rates are not super high, but patterns of intention suggest these conversations are important. When it comes to politics, Americans are seeking information from Claude, rather than advice or direct recommendations. When an election is upcoming, they seek out more information. Clearly, there is an important set of voters for whom Claude is an important helper. As we build towards political superintelligence, this is a promising foundation we can start from.
The next question, of course, is: when Americans ask Claude or other AI helpers about politics, do they get back good answers? To understand this, we’ll need to go beyond the coarse-grained data currently available. We need to understand the precise political topics Americans are seeking help with, and the nature of their requests. Then, we’ll need to develop notions of what a “good” answer looks like, so that we can evaluate models against these, and then train them to do better. That’s how we can continue working towards political superintelligence.
Statistical Appendix
Looking for signs of a statistical fluke
The increase we observe in states holding May primary elections could be a fluke—we don’t have a large sample size of states to work with, after all. We run a number of additional tests to try to address this concern.
First, we compare the increase in political conversations from April to May in the eight May-primary states to the change in political conversations over the same period in 22 states with primary elections held after May.
These are the 22 states with light blue dots and arrows in the figure above. The share of political conversations in those 22 states barely changes from April to May, suggesting that the change in the May-primary states is due to something special about those states rather than a nationwide change in the share of political conversations with Claude.
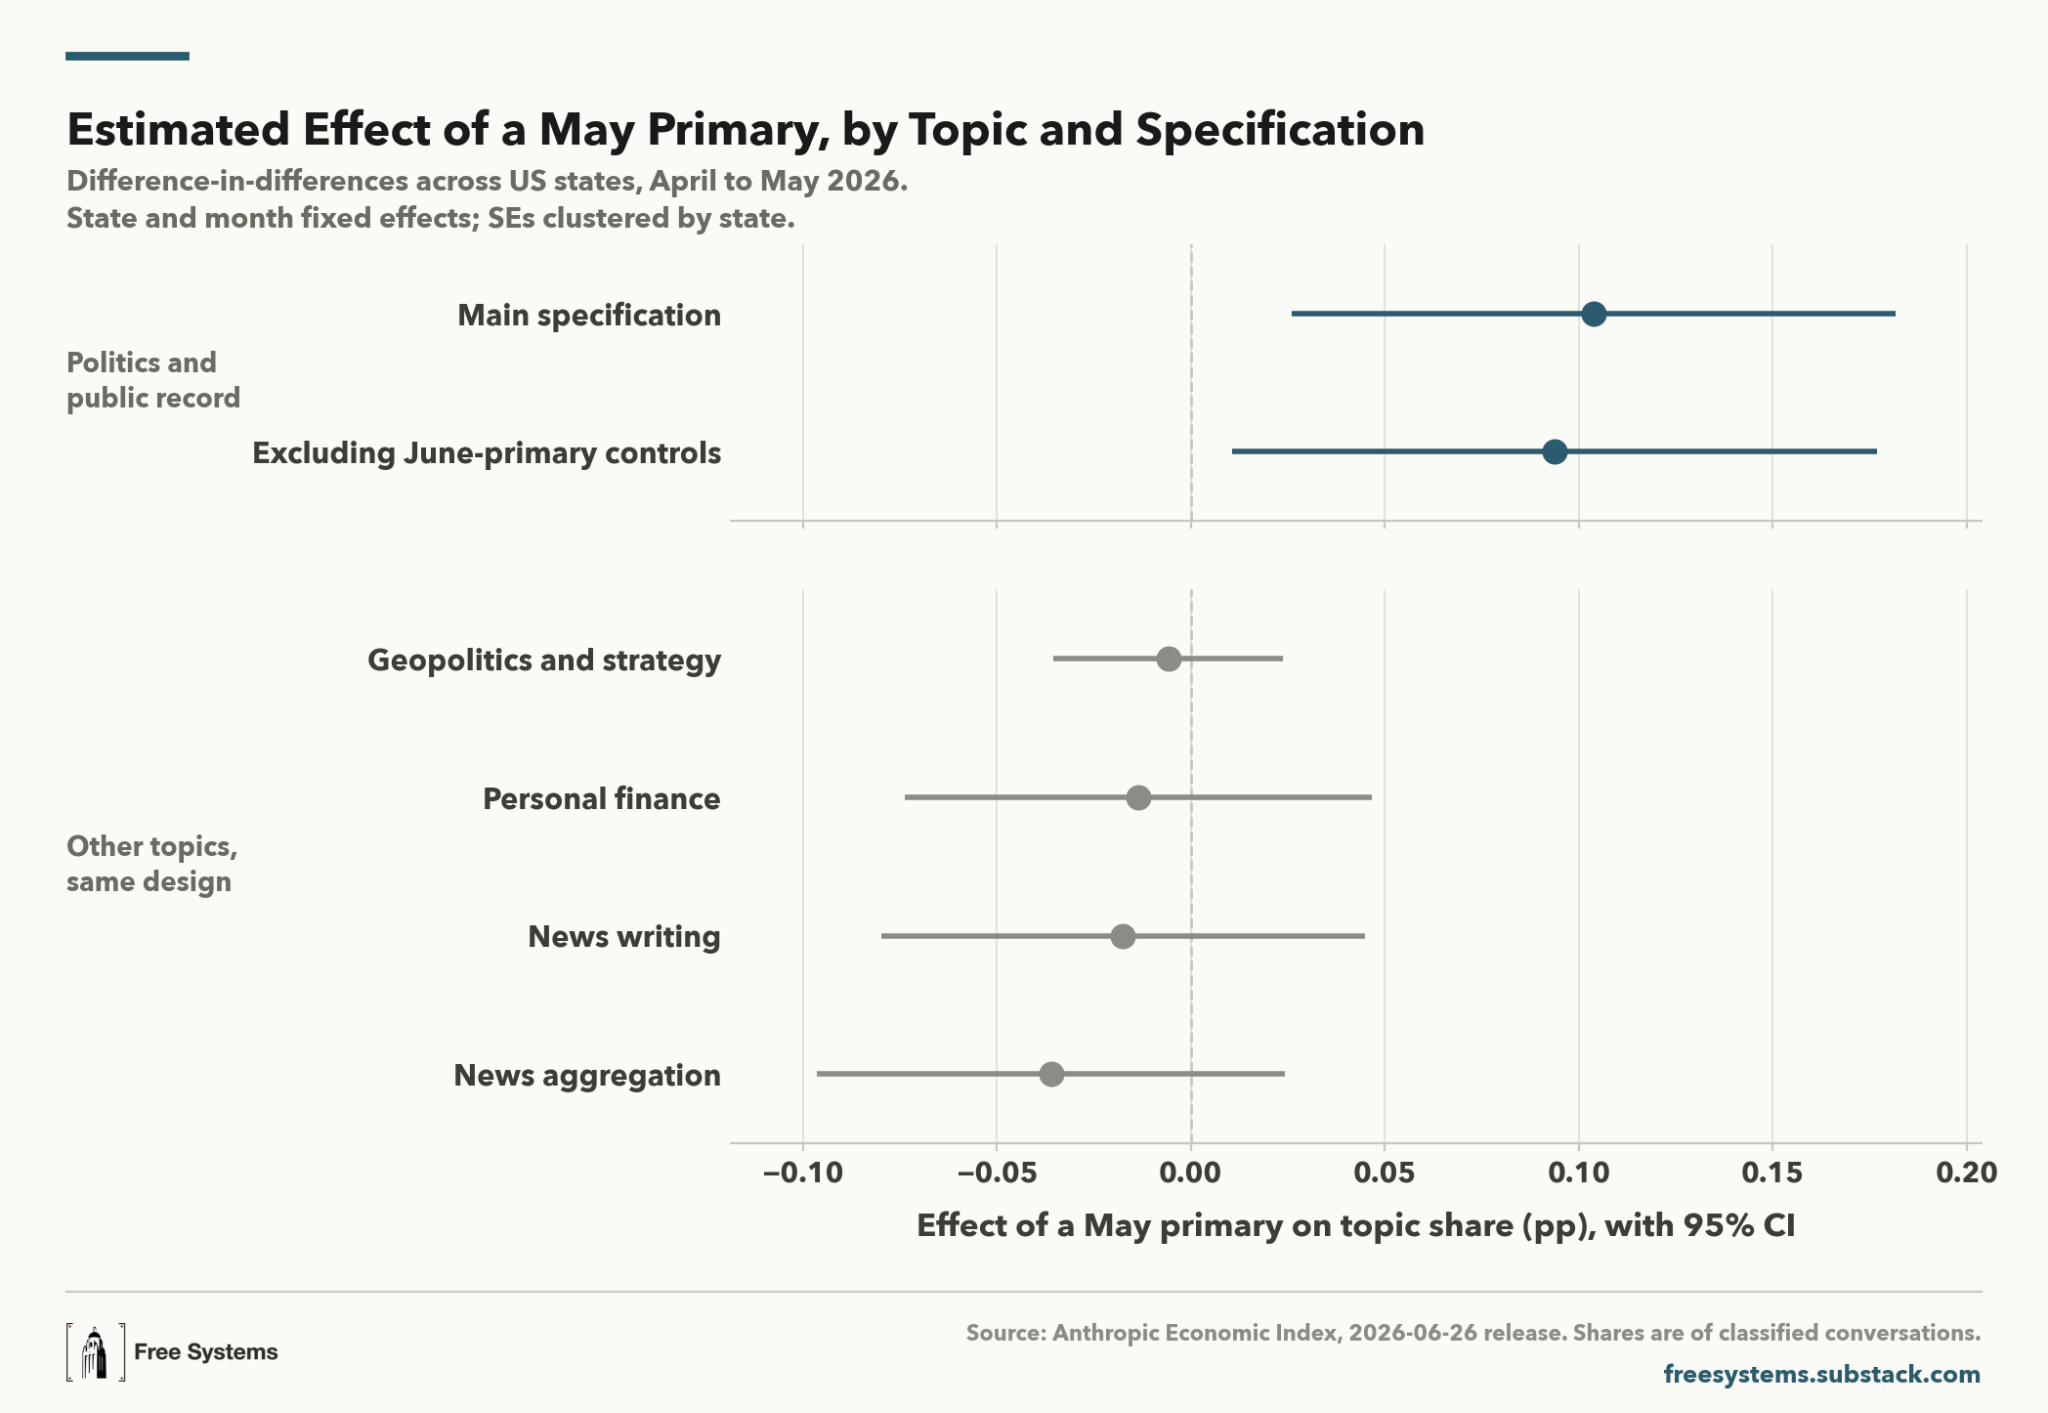
Using these 22 states as control states in a difference-in-differences design presented in the figure below, we estimate that primaries increased the share of political conversations by approximately 0.1 percentage points or 20% in May. Removing states with June primaries from the control group did not meaningfully change our estimate.
Reassuringly, we do not see similar increases in conversations about geopolitics, personal finance, news writing, or news aggregation in the May-primary states compared to the later primary states—the effect really does seem to be concentrated in the political category, where we would expect it to be if it’s about the election itself.
Finally, if our results are real, it should be unusual for May-primary states to have larger changes in non-political categories when compared to post-May-primary states. We compute simple differences-in-differences estimates of the effect of primaries on the share of conversations about each of the 210 topics are data allow us to study. We standardize the estimates into t statistics where more positive means May-primary states saw increases in the share of AI conversations about that topic more than we would expect based on national trends. Political conversations stand out. Only two topics out of 210 increased more in May-primary states. This suggests that this is very unlikely to have happened by chance—the primaries appear to have caused a substantial increase in the share of AI conversations about politics.
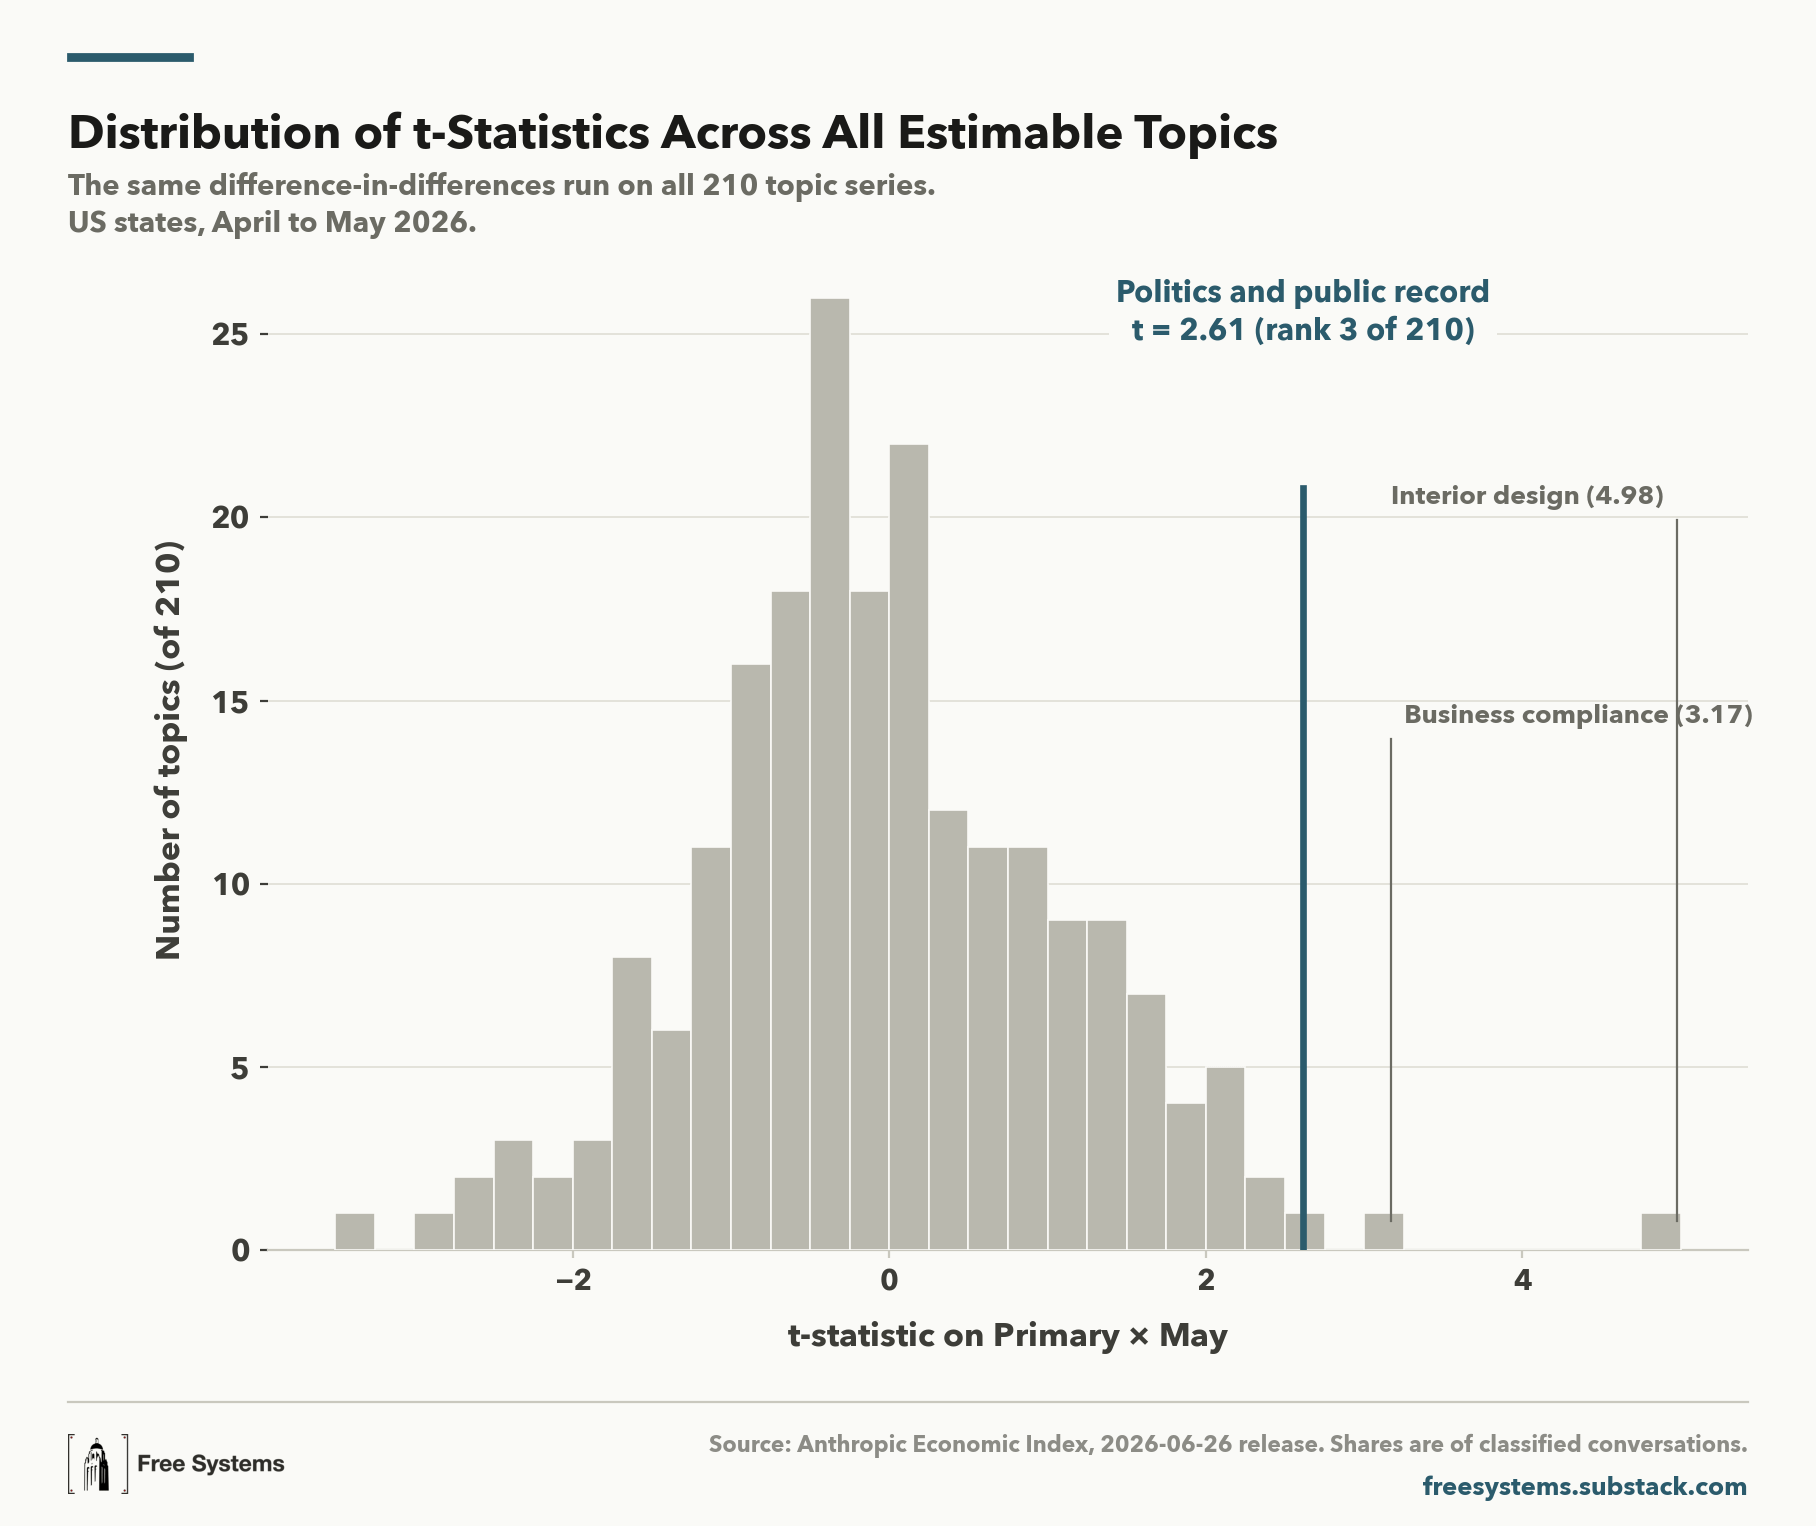
It is also worth pointing out that these are probably underestimates of the amount of political conversations driven by primary elections. Using Google Trends data, we can see that search volume about primary elections was already substantially elevated in these eight May-primary states in April. Searches for “primary election” tracked very closely in the eight states with May primaries and the 22 states with post-May primaries, but these trends diverged substantially in April then again even more in May. If the patterns in political AI use track the patterns in election-related Google searches, the April to May change in political conversation share meaningfully understates the number of conversations people are having with AI about their primary elections.
 | A guest post by
|
To me the main question is whether analysis/information actually changes preferences or vote choice — ie voters presumably ask about stuff they are not yet very confident about, so the pass-through to preferences might be stronger when voters themselves seek out info (compared to settings where such info is exogenously shown to voters). In that case, if we assume preferences are a function of some beliefs and that function upweighs more certain beliefs, then the informational signal from Claude might actually have nontrivial preference effects.
(however this may not hold under different assumptions)
I use chatbots for downballot elections/ballot questions that are totally off the news cycle for ~99% of people. Like a quick and dirty on county council elections or something like that.